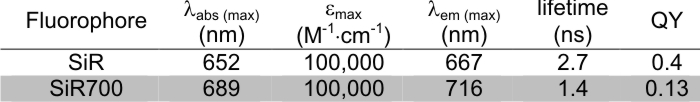
Dual colour imaging with SiR- and SiR700-probes:
SiR700 is a member of the silicon rhodamine (SiR) family. SiR700 is a close analogue of SiR with ca 50 nm red shifted absorption and emission. These changed spectral properties allow SiR700-probes to be used in combination with SiR-based probes for dual colour imaging of live cells. As their previous SiR analogues, SiR700-based probes are cell permeable, far red and fluorogenic. SiR700 probes for actin, microtubules, DNA and lysosomes are available.
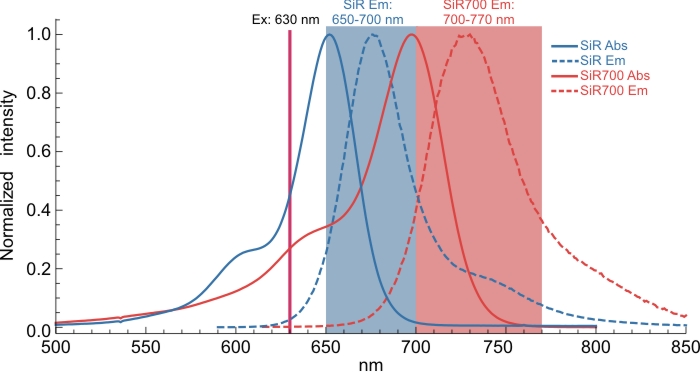
SiR and SiR700 emission can be spectrally resolved and excited by the same laser line. Using the following recommended microscope settings it is possible to obtain dual colour images of live cells. Confocal, SIM and STED are all suitable for dual colour imaging of live cells with SiR- and SiR700-probes.
Tips for dual colour imaging:
– As the brightness of SiR700 probes is lower than the corresponding SiR-probes, it is recommended to choose the structure that gives the highest signal as the SiR700 version. The order of signal intensity for our probes is the following: DNA > actin > tubulin > lysosome. For example, if DNA and microtubules are to be images simultaneously with our probes, please choose SiR700-DNA and SiR-tubulin pair. This will also minimize the impact of SiR fluorescence bleed through into the SiR700 channel.
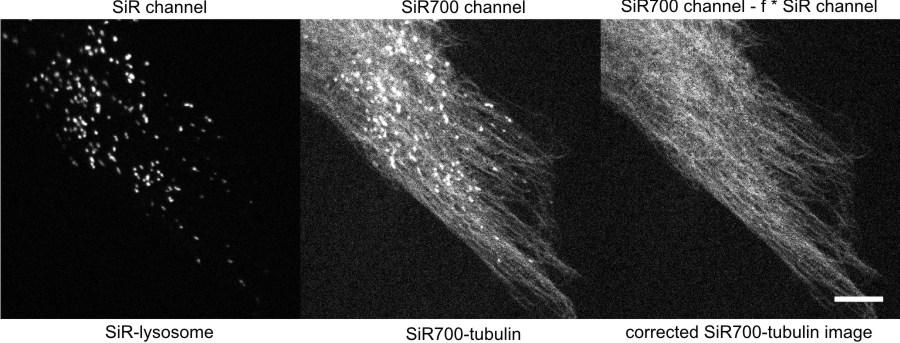
– The bleed through of SiR into the SiR700 channel will strongly depend on your microscope optics and settings and it cannot be fully avoided as the emission spectra SiR and SiR700 overlap. However, a simple procedure yields good results. It consists of performing a post acquisition image subtraction by subtracting to the SiR700 channel with the SiR channel image multiplied by a factor that has to be estimated:
corrected SiR700 channel image = SiR700 channel limage – f * SiR channel image
“f” being a factor which is usually between 0.1 and 0.4. This procedure is very simply done with ImageJ or FIJI (with e.g. the image blend plugin).
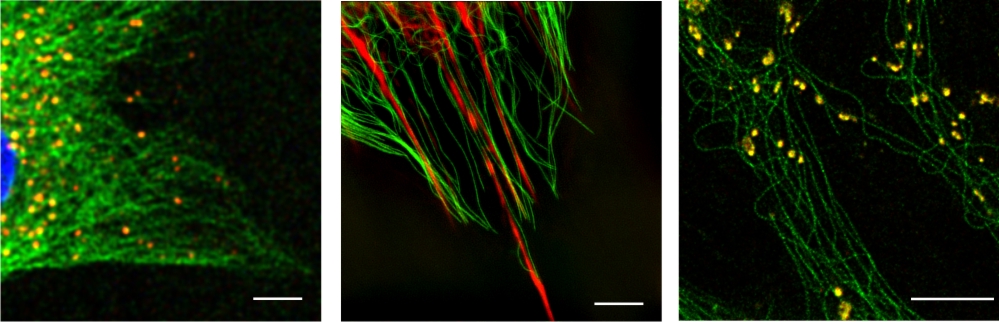
Dual colour imaging examples
Dual colour imaging examples